Getting Started – Nginx Amplify with PHP-FPM
Nginx Amplify is my new found extensive Nginx monitoring and metrics, with general server metrics included. This article will walk you through how to install and start monitoring in under 2 minutes! Every request coming through my server goes through Nginx, thus such a one-stop-shop for metrics and monitoring related to Nginx is just so timely and useful for me.
You can read more about Nginx Amplify
Remember that all commands in this article are to be issued on your remote server. If you don’t have Nginx on your server, then this might not be the monitoring and metrics gathering tool you’re looking for.
Otherwise, let’s get going!
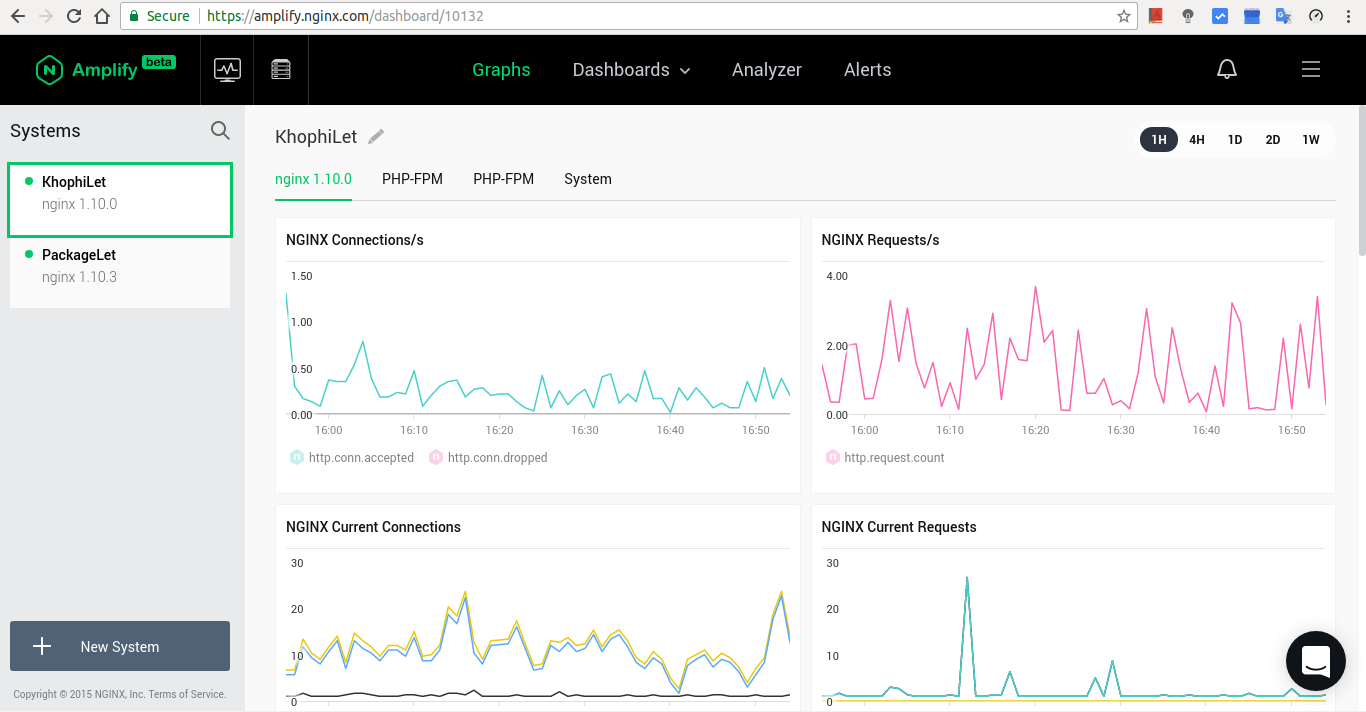
When we’re done, you should have something like this:
Installation
Installation of the Nginx Amplify is just so seamless. Here:
$ curl -sS -L -O https://github.com/nginxinc/nginx-amplify-agent/raw/master/packages/install.sh
$ API_KEY='ffeedd0102030405060708' sh ./install.sh
Make sure to restart the amplify-agentjust after installation. I had issues without restart.
$ service amplify-agent restart
Done!
Configuration Nginx Metrics
By default, you might not have the stub_status enabled in your Nginx configuration anywhere. So we need to configure that.
Create a /etc/nginx/conf.d/stub_status.conf file and put these in there:
server {
        listen 127.0.0.1:80;
        server_name 127.0.0.1;
        location /nginx_status {
                stub_status on;
                allow 127.0.0.1;
                deny all;
        }
}
Be sure to include contents of the /etc/nginx/conf.d/* folder in your main nginx.conf file.
Run $ nginx -t to check the nginx configuration if working fine and there are no errors.
$ service nginx restart
Truly stopping Nginx can be troubling for me via the service restarts command as shown above. Thus, in my Monit restart command, I use this instead
/sbin/start-stop-daemon --quiet --stop --retry QUIT/5 --pidfile /run/nginx.pidIf that fails, a means of last resort is to use the command below:
sudo fuser -k 80/tcp
Now give your Nginx Amplify Dashboard some time to start seeing some metrics showing. We’ll enable the rest in a jiffy. However, you should start seeing some metrics when you change to the 1H time interval for the graphs.
As you wait for the Dashboard to populate the metrics it pulls at 1-minute intervals, you can check if your stub_status is working as expected.
$ curl -v http://127.0.0.1/nginx_status
You should get a response similar to this:
$ curl -v http://127.0.0.1/nginx_status
*   Trying 127.0.0.1...
* Connected to 127.0.0.1 (127.0.0.1) port 80 (#0)
> GET /nginx_status HTTP/1.1
> Host: 127.0.0.1
> User-Agent: curl/7.47.0
> Accept: */*
>
< HTTP/1.1 200 OK
< Server: nginx
< Date: Wed, 05 Jul 2017 17:03:18 GMT
< Content-Type: text/plain
< Content-Length: 108
< Connection: keep-alive
<
Active connections: 22
server accepts handled requests
 1559 1559 7633
Reading: 0 Writing: 1 Waiting: 21
* Connection #0 to host 127.0.0.1 left intact
If something like the above shows, then you have your stub_status working.
More Nginx Metrics
‘NGINX Amplify can collect a number of additional useful metrics which will be added to the Graphs page if the agent finds additional metrics. With the required log format configuration, you’ll be able to build more specific custom graphs.
‘The access.log log format should include an extended set of NGINX variables. Please add a new log format or modify the existing one — and use it with the access_log directives in your NGINX configuration.’
log_format  main_ext  '$remote_addr - $remote_user [$time_local] "$request" '
                      '$status $body_bytes_sent "$http_referer" '
                      '"$http_user_agent" "$http_x_forwarded_for" '
                      '"$host" sn="$server_name" '
                      'rt=$request_time '
                      'ua="$upstream_addr" us="$upstream_status" '
                      'ut="$upstream_response_time" ul="$upstream_response_length" '
                      'cs=$upstream_cache_status' ;
Now with the main_ext variable, we need to apply that to the access.log of our Nginx configurations.
If you explicitly indicate an access log per each virtual host, you might have to do this step for all the virtual hosts you want logging in a way the Nginx Amplify Agent can pick up. Otherwise, (such as in my case), doing the following should get the variable applied to all your Nginx Access logs:
access_log  /var/log/nginx/access.log  main_ext;
# and set your error log to 'warn'
error_log /var/log/nginx/error.log warn;
Then,
$ nginx -t && service nginx restart
As we wait for the recent changes to start populating on our Nginx Amplify Dashboard, let’s move on to rig our php-fpm to also send in some metrics.
Configuring PHP-FPM
If you run a WordPress instance, you very likely have php-fpm running on the system. We need metrics from this process too, and here we wanna configure that.
Make sure to take note of the specific php-fpm version you’re using, either for php7.1 or php7.0. On my box, I’m using PHP7.1, thus
On my box, I’m using PHP7.1. You can confirm what version you’re using by checking your Nginx configurations related to fastcgi and notice the PHP sock it is connected to.
Mine looks something like this, which I put in my /etc/nginx/snippets/wordpress.conf
location ~ \.php$ {
    ....
    fastcgi_pass unix:/run/php/php7.1-fpm.sock;
    ....
}
If we’re using php7.1-fpm, then it means we’re using the file /etc/php/7.1/fpm/pool.d/www.conf in which we’ll be confirming the following:
-
pm.status_pathis set. If not set, it usually looks like this:pm.status_path = /status. If it exist but commented, please uncomment it. - The owners for the
php-fpmservice user group is same as the Nginx running service, in my caselisten.owner = www-dataandlisten.group = www-data - And
[extensions]
phpfpm = True
is set
With all of the above successfully configured, the end result should be an additional tab displayed on the Graphs page, with the pre-defined visualization of the PHP-FPM metrics.
If you see two PHP-FPM tabs, then you very likely have 2 PHP-FPM instances running on your system (as shown in video below), although only one might be used for all your applications.
I always try to stay latest, thus with all my PHP-related applications i.e WordPress, inheriting from one single include nginx conf file, all I do is point the sock file to the most recent PHP instance. Automatically all my PHP-apps switch to using the latest PHP-FPM of the latest PHP.
I’m currently on PHP-7.1 FPM
Restart the agent one last time, and let the fun begin!
Conclusion
You should end up with something similar to what was shown in the early part of this article.
I’m personally enjoying this Amplify platform from Nginx. Nginx has been my go-to front-end server for almost all things, including even for MongoDB. It works, is fast, and lean! All my personal and client projects are served with Nginx.
The Amplify platform is a welcome addition and works amazingly. I hope this article got you started with Nginx Amplify.
Hope you see you in the next one.